Analytics
Review
Time
⏲
1hr/User
Difficulty
🕹
Hard
Materials
📦
Recording equipment
Spreadsheet to track responses
Incentives
People
🕴
2 Reserachers
2+ Users
Overview
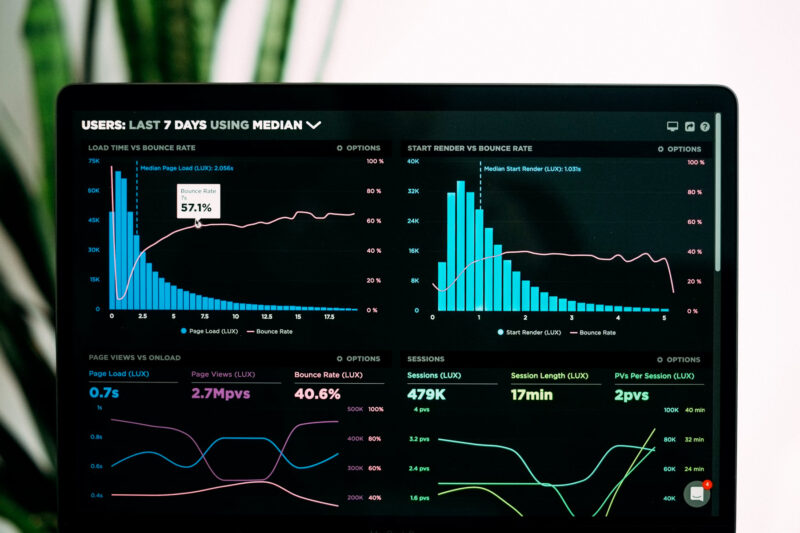
Remotely measuring how users interact with the product “in the wild.” This is a quantitative strategy which is good for supplementing conditions the researcher orchestrated, like usability testing).
What
Analytics Reviews: remotely measuring how users interact with the product “in the wild.” This is a quantitative strategy which is good for supplementing conditions the researcher orchestrated, like usability testing).
Examples of data which analytics reviews can provide:
- how fast mobile access is growing
- what content is shared most often
- what desirable actions people take with the product
- how quickly users complete tasks
- how many projects users generate
Why
Advantages
- Cheap
- Gathers authentic “in the wild” data
- Notifies the team of potential problems reaching goals
- Identifies potential causes of issues
- Helps prioritize which issues need to be fixed
- Adds data to supplement qualitative research
Disadvantages
- Needs to be combined with qualitative tools in order to make sense of the data (WHY did they spend a short time on this page – because it was easy to use and they did everything they needed? because it was too hard to use so they gave up something else?)
When
When might a field study be the right research methodology?
- You need big picture insights
- You don’t know enough about your actual prospective users
- You need to understand how people normally do their work and how they set up their environment to support their tasks.
- You don’t know enough about your users’ context (cultural, use, etc.)
- You need to understand how groups of people behave
- Your participants can’t travel to your location
When you should consider a different methodology?
- When what you’re testing may be confidential or private
- You need many observers present at the research session
- The focus is mostly on the users’ usability of the system, not their context
- When a remote study (which is cheaper and faster) will produce the same set of results
Steps
Step 1 Make a research plan
Make a plan
Step 2 Ready your participants
- Schedule an onboarding session to set expectations
- Create a cheat sheet (who to contact, when to log, etc.)
- Share rewards structure (diary studies are a lot of work and participants should be paid for their time)
Step 3 Log and Process
- Frequently communicate with your participants
- Send reminders
- Provide guidance
- Acknowledge entries coming in
- As data comes in…
- Take notes
- Transcribe videos or audio entries
- Write any follow-up questions
Step 4 Follow-up and Learn More
- Schedule follow-up interviews with your most engaged participants
- Ask for participant feedback
- Turn your qualitative data into quantitative data with follow-up surveys, usability tests, A/B tests, etc.
Step 5 Analyze and share
- Synthesize the data
- Create a summary of findings
- Tag like-items to find patterns (i.e. “distracting” or “hard” were common terms used)
- Share insights with stakeholders
Tools
None